Jump to: Overview | Instructions | Download
The Biomass Enterprise Economic Model is designed to help users rapidly evaluate and appropriately scale biomass utilization enterprises. Users can explore how woody biomass input volumes and the salable products mix influences capital establishment costs, annual operating costs, and annual revenue. The model is pre-loaded with cost and pricing data that automatically scales to the specific design scenario selected by the user. Many of the cost factors and product sales prices are also user-editable, to account for existing assets or different configurations and market conditions. The user can quickly see the impact of key variables on annual cash flow, capital investment, and simple payback. The details associated with attractive scenarios can be downloaded and saved.
Step-by-step user instructions are downloadable and provided in full below.
A general overview:
Model users begin by specifying the scale of the enterprise to examine. Four basic size classes are available; Small, Medium, Large, and Major, and each is determined by the annual volume of woody biomass material available as raw material. The primary functional unit is the bone dry ton, or bdt. The user specifies the form the biomass will be in when delivered to the plant gate, and a desired product mix that is achievable with that raw material form. The kinds of enterprises supported by the model generally require starting with logs. Field-ground biomass or bundled tops and limbs may be suitable for making energy or biochar, but are not suitable for generating pulp chips, firewood, posts & poles, or boards. Short logs, specified as "chunk wood" is a third choice. Only Large and Major scale enterprises can justify the complexity to process both logs and non-log material simultaneously. The Model is not designed to evaluate depots for transferring field grindings to biorefineries or power plants.
The mix of salable products must reflect the realities of the conversion technologies. If clean chips are desired, then allowances must be made for bark and other losses in the form of hog fuel. A small sawmill or post & pole plant will produce by-products in the form of sawdust and shavings, as well as hog fuel and off-quality product. The Model is designed to assist the user with designation of appropriate by-products associated with primary products. In all cases, the economic data is generated from the bdt raw material input and the specified product mix. Conversion factors, such as bdts of logs to cords of firewood or number of standard fence posts, are built in.
This Model should be used as a tool for getting a general idea of the economics of biomass enterprises, and insights into how variables such as plant size, product mix, and market prices influence viability. It should not be used to justify a business plan, and is no substitute for diligent research into markets and production costs. Users should view it as a starting point. By running various "What if" scenarios, it can show which configurations may be viable and which others have no chance of ever making a profit.
Step-by-step user instructions:
- Download and save the model. Extract the jar from the zip.
- Click on the Main data window button.
- Select the facility size category, then use the pull-down menu to specify bdt/year.
- Select the Biomass form, and percentage of each, from the choices of Logs, Ground biomass, or Chunk wood. Default delivered prices of each are specified, but can be changed using the pull-down menu.
- Select the Design Construction Category to evaluate. Always start with New. This will base the Capital Estimate on a suitable industrial site, all new equipment, and professional design & construction support. Used Equipment de-values the New estimate considerably, and Practical Balance assumes a reasonable mix of new and used equipment and owner-installation expertise.
- Select one of the Plant Configurations supported by the model for the specified size class. The choices change with each size class. Only Satellite chip plants and Firewood operations are supported for Small operations. The choices for the Medium class expands to Post & Poles and Sawmilling. Large facilities can include a boiler for making kiln dried firewood. Only Major facilities with inputs in excess of 50,000 bdt/year can have the versatility and complexity to make biochar and other thermal products in an "Integrated Ecoplex".
- Specify a target Sales Mix by percent of each product. The Model assumes that all of the biomass input will be converted into products or by-products. The ratios must be realistic, and hog fuel will never be less than 10%. Default market prices for each product and by-product are pre-loaded, but can be edited by the user.
Push the Run Calcs button. This button will show red whenever a change is made to the Main data window, and turn clear after pushed. At this point, the screen will look something like this:
Image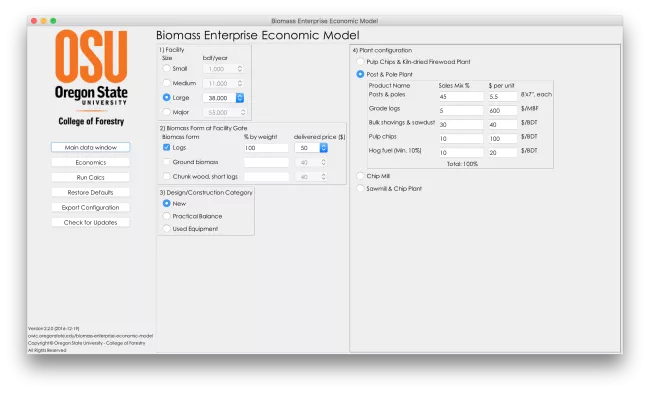
- Push the Economics button to switch windows and view the results of the selected scenario evaluation.
- The center of the Economics screen will show the Capital Costs broken down into eight subtotal categories and a grand total. Each of the categories has a toggle button for showing the details for that category. Pushing the Show Details button opens an editable list for changing line item costs. Feel free to make changes to the cost items. The original values can be recovered by pressing the Restore Defaults button.
- The right side of the screen displays the Operating Economics broken down into Sales Revenue, Labor Raw Material costs, Operating expenses, EBITDA (earnings before income tax, depreciation, and amortization), and simple payback. Show Detail toggle buttons allow examination and editing of the Labor, Liquid fuel, and Electricity categories. Edits return to original values when Restore Defaults is pushed.
- Sales Revenue is calculated from the user-selected product mix and prices. Return to the Main data window to examine the impact on revenue from different mixes or product sales prices.
The Economics screen, companion to the Main data window shown above, will look something like this:
Image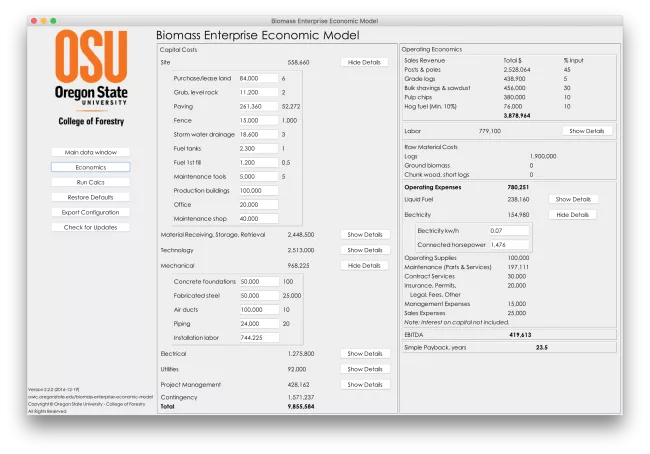
- Configurations of particular interest can be downloaded as .pdf files and saved for future reference by pressing the Export configuration button.
- Users are encouraged to explore different configurations to get a feel for how the economics change. Just remember to press the Run clacs button before examining the new Economics. Nothing is ever lost. Original default values can always be restored with a push of the button.


Version 2.2.0 • Dec 19, 2016
Requires Java version 8 or higher: Download Java